Graphing Solution Sets for Inequalities
First, take a very simple inequality, y  1. The solution set consists of all
points whose y-coordinate is greater than or equal to 1. These
points are contained in the shaded region in the graph below. 1. The solution set consists of all
points whose y-coordinate is greater than or equal to 1. These
points are contained in the shaded region in the graph below.
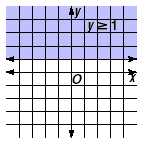
This kind of region is called a half-plane
because it is one of two parts of the plane into which a boundary
line divides it. In this case, the region consists of all those
points that lie on and above the line y = 1.
Another example is y  1. The “greater than or equal
to” is changed to “less than or equal to”. The
solution set for this inequality is shown below. 1. The “greater than or equal
to” is changed to “less than or equal to”. The
solution set for this inequality is shown below.

It is also a half-plane. In this case, the solution set
consists of all points in the half-plane including and below the
line y = 1.
In both cases, the equation of the boundary line is found by
replacing the inequality symbol with an equals sign.
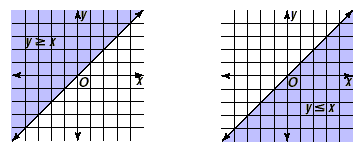
Consider y  x. The equation of the boundary line is y
= x , which is found by replacing the inequality symbol with an
equals sign. The solution set for the inequality is the
half-plane including and above the line. In the same way, the
graph of the solution set for y x. The equation of the boundary line is y
= x , which is found by replacing the inequality symbol with an
equals sign. The solution set for the inequality is the
half-plane including and above the line. In the same way, the
graph of the solution set for y  x is the half-plane including and below
this same line. x is the half-plane including and below
this same line.
The solution sets for both inequalities are shown below.
The following general key idea is always true.
Key Idea
For any linear inequality, if the inequality symbol is
replaced with an equals sign, the result is a line that divides
the plane into two half-planes. The solution set for the
inequality is one of these half-planes.
Example 1
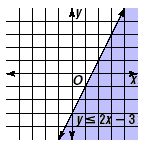
Graph y  2x - 3. 2x - 3.
Solution
First, replace the inequality symbol in y 2x - 3 with an
equals sign, in this case y = 2x - 3. Graph the line.
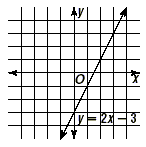
Now, since the inequality states that the y-coordinate is
greater than or equal to the linear expression in x , the
solution set for the inequality is the set of points above this
line.
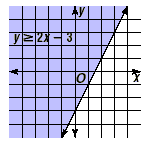
This is shown in the shaded region above.
If the inequality symbol were reversed and the inequality was
y  2x - 3, the solution set would be the set
of points below this line, as shown below. 2x - 3, the solution set would be the set
of points below this line, as shown below.
Key Idea
• If a linear inequality sets y greater than or equal to
the linear expression in x, then the solution set is the set of
points above the boundary line.
• If a linear inequality sets y less than or equal to the
linear expression in x, then the solution set is the set of
points below the boundary line.
Using this key idea, the solution set for y  5x - 7 is the set of points above the
line y = 5x - 7. The solution set for y 5x - 7 is the set of points above the
line y = 5x - 7. The solution set for y  x - 1 is the set of points below the line
y = x - 1. x - 1 is the set of points below the line
y = x - 1.
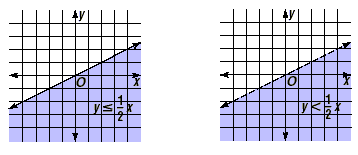
So far, only inequalities containing  and and  have been graphed. Inequalities with the
symbols < and > are just as easy to graph. have been graphed. Inequalities with the
symbols < and > are just as easy to graph.
Key Idea
• When the inequality symbol is  or or  , draw a solid line on the boundary of the
half-plane to indicate that the boundary line is included. , draw a solid line on the boundary of the
half-plane to indicate that the boundary line is included.
• When the inequality symbol is < or >, draw a
dashed line on the boundary of the half-plane to indicate that
the boundary line is not included.
This key idea is illustrated by the graphs shown below.
|