Solving Linear Equations and Inequalities Graphically
The Equation of a Linear Equation
A linear equation written in slope-intercept form always follows the pattern:
y = m · x + b,
where the letter x represents that values of the input, the letter y represents that values of
the output and the letters m and b represent fixed numbers. The number represented by m
is called the slope and the number represented by b is called the intercept.
You can find formulas for linear equations by hand (for example if you are given the
coordinates of two points and asked to find the equation of the line that joins them) or by
linear regression.
The Idea of Solving a Linear Equation Graphically
When you have a linear equation, and know the value of the output, you can solve the
equation to find the corresponding input value. This is sometimes called solving the
equation for x.
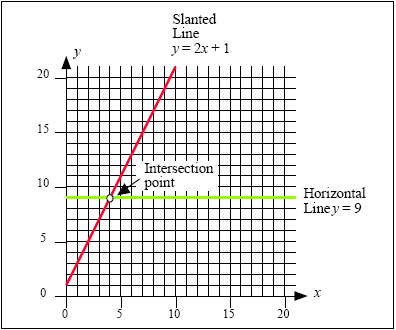
One way of thinking about the process of solving a linear equation like:
2 · x +1= 9,
is that you are trying to find the x-coordinate of the point where the line y = 2
· x +1 reaches a height of 9 units (see Figure 1, below). The x-value of the point where the
slanted line represented by the equation y = 2 · x +1 and the horizontal line represented
by the equation y = 9 is the solution of the linear equation 2
· x +1= 9.

Figure 1: The solution of a linear equation is the x-coordinate of the intersection
point.
The Idea of Solving a Linear Inequality
A linear inequality is a lot like a linear equation, except that the equals sign is replaced
by less than (<), greater than (>), less than or equal to
 or greater than or equal to or greater than or equal to
 . For example: . For example:
-2 · x + 3
 11. 11.
When you solve an inequality, the idea is to re-arrange the inequality to make x the
subject. Unlike solving an equation, when you solve an inequality, you will usually get
an interval of x-values as your solution, rather than a single x-value.
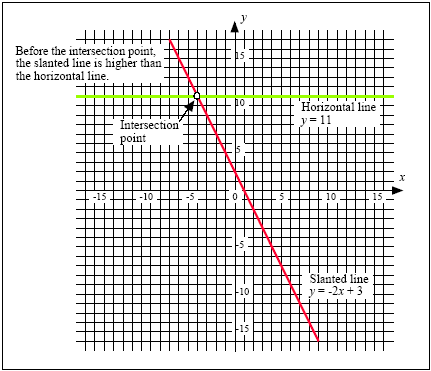
You can solve a linear inequality by breaking it down into two separate equations, just as
you did for linear equations. For example, to solve the linear inequality:
-2 × x + 3
 11, 11,
what you are trying to do is find out when the graph of the slanted line y = -2
· x + 3 is as
high (or higher) than the graph of the perfectly horizontal line y = 11.

Figure 2: The solution of a linear inequality is the interval of x-values before or after the intersection
point. If the inequality is >= or <= then the interval will also include the x-coordinate of the intersection
point.
|