Solving Linear Inequalities
Suppose we have two expressions, 2x + 3 and -2y + 9.
A linear equation, such as 2x + 3 = -2y + 9, consists of two expressions
joined by an equals sign, =.
A linear inequality, such as 2x + 3 < -2y + 9, consists of two
expressions joined by an inequality symbol: <, ≤,
≥, or >.
Definition —
Linear Inequality in Two Variables
A linear inequality in two variables, x and y, is an inequality that can
be written in one of the following forms:
Ax + By < C, Ax + By ≤ C, Ax + By > C, Ax
+ By ≥ C, where A, B, and C are real numbers and A and B are not both 0.
A solution of a linear inequality in two variables is an ordered pair,
which when substituted in the inequality, results in a true statement. That
is, a solution that satisfies the inequality.A linear inequality, such x + y
< 3, has infinitely many solutions. To
identify these solutions, we often use the graph of the corresponding linear
equation.
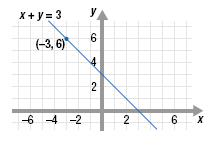
For example, consider the graph of the linear equation x + y = 3.
Notice that the line divides the xy-plane into three regions:
• Points above the line.
• Points on the line.
• Points below the line.

Points on the line, such as (-3, 6), are solutions of the equation
x + y = 3.
Points NOT on the line are solutions of one of the following inequalities:
x + y < 3
x + y > 3.
Example 1
Determine if each ordered pair is a solution of x + y < 3.
a. (0, 0)
b. (5, 0)
c. (-3, 6)
Solution
| a. |
Substitute 0 for x and 0 for y.
Simplify. |
Is 0 + 0
Is 0 |
< 3 ? < 3 ? Yes |
| |
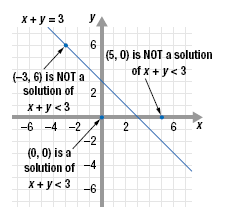
Since 0 < 3 is true, the ordered pair (0, 0) is a solution of x
+ y < 3.
Notice that the point (0, 0) lies below the line x + y = 3. |
| b. |
Substitute 5 for x and 0 for y.
Simplify. |
Is 5 + 0
Is 5 |
< 3 ? < 3 ? No |
| |
Since 5 < 3 is false, the ordered pair (5, 0) is NOT a solution of
x + y < 3.
Notice that the point (5, 0) lies above the line x + y = 3. |
| c. |
Substitute -3 for x and 6 for y.
Simplify. |
Is -3 + 6 Is 3 |
< 3 ? < 3 ? No |
| |
Since 3 < 3 is false, the ordered pair (-3, 6) is NOT a solution of
x + y < 3. |
Notice that the point (-3, 6) lies on the line x + y = 3.

Recall that a line divides the xy-plane into three regions: points on the line
and points on either side of the line.
If a point in a region satisfies an inequality, then every point in that region
satisfies the inequality. Likewise, if a point in a region does not satisfy an
inequality then no point in that region satisfies the inequality.
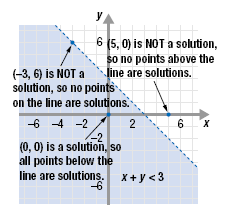
In the previous example we found that
• (0, 0) is a solution of x + y < 3.
Since (0, 0) lies below the line x + y = 3, every point below the line
a solution of x + y < 3.
To graph these solutions, shade the region below the line.
• (5, 0) is not a solution of x + y = 3.
Since (5, 0) lies above the line x + y = 3, no point above the line is a
solution of x + y < 3.
• (-3, 6) is not a solution of x + y < 3.
Since (-3, 6) lies on the line x + y = 3, no point on the line is a
solution of x + y < 3.
To show this, we use a dotted line for x + y = 3.
The points (0, 0) and (5, 0) are often called test points.

A test point is a point that we substitute in a linear inequality to determine
the region of the xy-plane that represents the solution of the inequality.
The solution of the inequality x + y < 3 is the set of all ordered pairs in
the region below the line x + y = 3. The graph of the inequality is the
shaded region. (The line is not included.)
Note:
For a test point, we can use any point NOT
on the line.
You may want to choose a test point from
each side of the line to check that you have
found the region that represents the
solution.
|