Solving Quadratic and Polynomial Equations
When you solve a quadratic equation when you have been given a y-value and need to
find all of the corresponding x-values. For example, if you had been given the quadratic
equation:
y = x2 + 8 · x +10,
and the y-value,
y = 30,
then solving the quadratic equation would mean finding all of the numerical values of x
that work when you plug them into the equation:
x2 + 8 · x +10 = 30.
Note that solving this quadratic equation is the same as solving the quadratic equation:
| x2 + 8 · x +10 - 30 = 30 - 30 |
(Subtract 30 from each side) |
| x2 + 8 · x - 20 = 0 |
(Simplify)
|
Solving the quadratic equation x2 + 8 · x - 20 = 0 will give exactly the same values for x
that solving the original quadratic equation,
x2 + 8 · x +10 = 30, will give.
The advantage of manipulating the quadratic equation to reduce one side of the equation
to zero before attempting to find any values of x is that this manipulation creates a new
quadratic equation that can be solved using some fairly standard techniques and formulas.
Solving a polynomial equation is exactly the same kind of process as solving a quadratic
equation, except that the quadratic might be replaced by a different kind of polynomial
(such as a cubic or a quartic).
The Number of Solutions of a Polynomial Equation
A quadratic is a degree 2 polynomial. This means that the highest power of x that shows
up in a quadratic’s formula is x2. The maximum number of solutions that a quadratic
function can possibly have is 2.
The maximum number of solutions that a polynomial equation can have is equal to the
degree of the polynomial.
It is possible for a polynomial equation to have fewer solutions (or none at all). The
degree of the polynomial gives you the maximum number of solutions that are
theoretically possible, not the actual number of solutions that will occur.
Example: Solving a Polynomial Equation Graphically
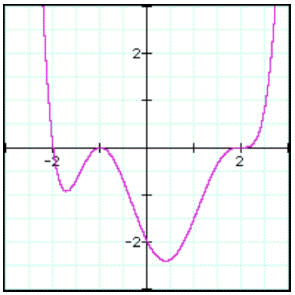
The graph given below shows the graph of the polynomial function:


Use the graph to find all solutions of the polynomial equation:

Solution
Graphically, as the polynomial equation is equal to zero the solutions of the polynomial
equation,

will be the x-coordinates of the points where the graph of the polynomial:

touches or crosses the x-axis. If you look carefully at the graph supplied above, the graph
of the polynomial touches or cuts the graph at the following points:
x = -2, x = -1, x = 2.
The solutions of the polynomial equation

are x = -2, x = -1 and x = 2.
|